


The Dot Plot Thickens
- Bob Decker

- Sep 19, 2023
- 4 min read

When will this market quit? Confused? Don't worry, you just need to read the plot.
Those among us who have adhered to the lessons learned during past monetary tightenings have remained pessimistic and wrong. The inverted yield curve is second in importance only to the Copper/Gold ratio in my toolkit of market indicators. Unfortunately, nobody told this bull market that higher rates matter. After 18 months the lead/lag fudge factor is too big to ignore this time. The model seems broken.
Chalk it up to the Covidian fiscal stimulus or the post-GFC balance sheet cleansing of the U.S. consumer, but this time has been different! The market may be primarily a monetary phenomenon but the R-squared to the normal indicators has dropped significantly. Is the immunity provided by the Pfizer vaccine also somehow protecting the consumer from rate hikes? More likely it's locked-in 30Yr mortgages and 2022 cheap corporate bond deals that are to blame.
Our hapless friends at the Fed, trained by an era of Greenspanian transparency, continue to show us the way forward for rates through their published "dot plot", shown below. Talking out of both sides of their mouth is now part of the job description at the FOMC. So despite their hawkish rhetoric about strangling inflation, they continue to publish a dovish pivot in their forecasts. Like the photo I showed in last week's message, they are implicitly declaring victory over their foe - Mission Accomplished. This has offered comfort to investors, allowing them to chase the narrowing S&P 500 ever-higher.
FED Dot Plot

But what if this curve is wrong? Among the more loose-lipped Fed Governors, Chris Waller has posited the soft landing case most recently. This week we will have another chance to see and hear from the monetary mavens at the Fed after their meeting concludes and the tea-leaf reading begins in earnest. Should they attach a higher probability of a non-recessionary outcome to the tight money phase, that would render the chart above highly specious. The downward slope assumes an immaculate disinflation to the 2% target can be magically achieved with a minimum of economic damage.
What we equity bears got wrong this year is two-fold. The lack of rate sensitivity in the economy and the positive supply-demand balance in risk assets that propped up the equity market. The economic left-tail risk that investors priced in late 2022 never materialized. Yes, there has been a slowing in the goods-producing industries, especially in consumer discretionary areas, but a strong service sector has cushioned the blow.
And in preparation for the effects of the Fed tightening, positioning and sentiment were poised for a bear market that had already occurred. Hence the narrow advance, in which a few strong economically immune mega stocks benefitted. I guess you can call it a bull market, but the equal-weighted average is still well below the highs and Growth has hammered Value in relative performance terms. I would offer that the trade is over now. A soft landing with commensurate higher rates implies that a recovery in the value trade is imminent.
Growth vs Value Factor ETFs

Should start to dawn on investors that inflation has started back up again, led by gasoline, the markets will have a period of indigestion. The current narrow rally based on the 'inflation is beaten' argument will prove backward-looking should the economy soft land. The recent huge upward surprise in the Atlanta Fed GDPNow number implies an acceleration that bonds and Fed Fund futures haven't accounted for. The hoped-for R* of 2.5% isn't likely given the easy financial conditions currently prevailing. Beware the bond market, it may soon sport a 5 handle across the board! Growth stocks will quickly come back to earth under such a harsh valuation stress test.
Atlanta Fed GDPNOW

A soft landing may also provide a temporary respite to the long-suffering cyclical sectors that have been left for dead. Banks will again be able to offset higher deposit costs with improved loan terms to eager borrowers as they recover from the sticker shock of higher rates. Commodities should start to benefit from low inventories and reduced supply after months of destocking and reduced cap-ex on the part of producers. Labour will regain real income growth as companies redistribute inflationary windfall profits to scarcity-empowered workers. The economy will learn to adapt to the new higher rate structure.
So we can expect the Fed to offer up a 'hawkish pause' this week, as Powell and company will talk harshly but carry a small stick. They are still fixated on their bumbling rearview mirror road trip that has left them consistently behind the curve. Their dot plots are a thing of aspirational fiction. In what alternate universe will 3% growth and 3% inflation result in a 3% Fed Funds rate next year?
A soft landing will lead to a stubbornly higher terminal inflation rate than expected. The dot plot will soon thicken.
Risk Model: 4/5 - Risk On
Only a slightly negative Copper/Gold ratio prevents the Model from going all bullish. I expect that will resolve positively once the current bout of seasonal weakness runs its course. The XIU (TSX Composite ETF) shown below has weathered the storm of a weaker global economy and the misplaced bearish sentiment on the part of foreign investors who have been subscribers to the overblown Canadian real estate bust theory. The chart is poised to breakout from a two year base now.
TSX ETF

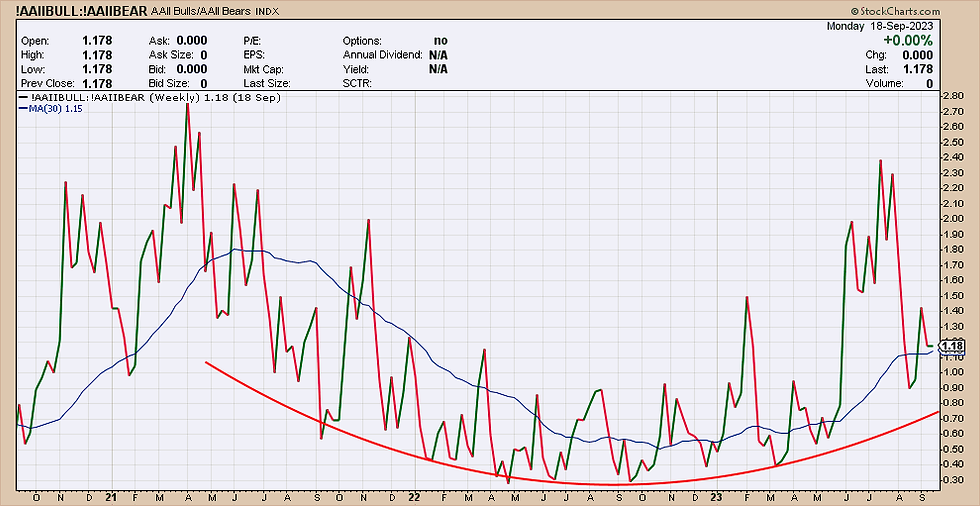
Sentiment has been trying to recover from the Fed rate hike shock of the last 18 months. More signs of economic resilience are required to reinforce the notion of an economy that has readjusted to higher nominal rates. A definitve Copper/Gold breakout would be just what is needed now.
AAII SENTIMENT
Copper/Gold Ratio


Commentaires